The Kazakhstan Outage - As Seen from RIPE Atlas

• 4 min read
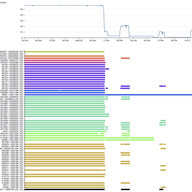
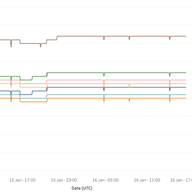
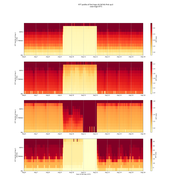
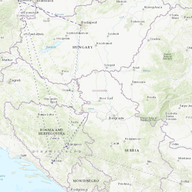
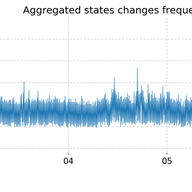
Starting at approximately 11:15 UTC on 5 January, we noticed what appeared to be a large scale Internet outage in Kazakhstan. We've been tracking the outage in RIPE Atlas since.

Based in Amsterdam, NL
Articles
Likes on articles
I'm a data scientist at the RIPE NCC. I'm a chemist by training, but have been working since 1998 on Internet related things, as a sysadmin, security consultant, web developer and researcher. I am interested in technology changes (like IPv6 deployment), Internet measurement, data analysis, data visualisation, sustainability and security. I'd like to bring research and operations closer together, ie. do research that is operationally relevant. When I'm not working I like to make music (electric guitar, bass and drums), do sports (swimming, (inline) skating, bouldering, soccer), and try to be a good parent.
• 4 min read
Starting at approximately 11:15 UTC on 5 January, we noticed what appeared to be a large scale Internet outage in Kazakhstan. We've been tracking the outage in RIPE Atlas since.
• 11 min read
We created a data aggregate we call 'minRTT' that gives the minimum latency into each ASN (and IXP!) from RIPE Atlas for a given day. This allows us to visualise network deployments and can help with insights into structural latency problems for a network. We build a few visualisations on top of th…

• 7 min read
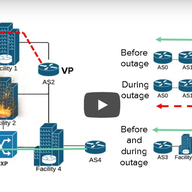
On 23 March 2021, LINX London experienced an outage. As this is one of the very large Internet Exchange Points, this is an interesting case to study in more depth in order to see what we can learn about Internet robustness.

• 6 min read
In this post we introduce a wiki to document RIPE Atlas measurements better. We use the measurements we created to track RPKI Repository Performance to show how this is useful.
• 13 min read
Over the past months we've been looking at our Routing Information Service (RIS) and thinking about how to make it best fit for purpose. Ahead of our upcoming RIPE NCC Open House on RIS, this post raises a set of open questions to our community aimed at starting a conversation about how we can keep…
• 4 min read
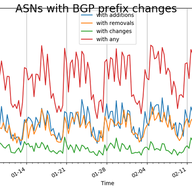
In this article we're sharing observations we made in the RIPE Routing Information System (RIS), our Internet data plane observatory.
• 11 min read
We are getting ready to start allocating from 2a10::/12, a new block of IPv6 addresses. In this process we did a couple of 'pre-flight' checks to check the usability of address space in this /12 block.

• 7 min read
This year's Internet Measurement Conference (IMC) was held in Amsterdam from 21-23 October. In this article we highlight some of the presented work that we think is interesting and that the RIPE community might find useful.
• 8 min read
Is the current set of the RIPE Routing Information Service (RIS) peers providing a good level of diverse data? Let's look at some measurement results.
• 3 min read
Will there be a 768k day similar to the 512k day we saw a few years ago? See here what we can see in the RIPE Routing Information Service (RIS).


“Thank you for this, Emil and Alun! From looking at the map you provided, it would be great to see an additional anchor in Katthammarsvik. Do you think it's worth trying to add one there?”
Thanks for the suggestion. I think that depends on the physical (cables) and logical (routing) topology near Katthammarsvik in relation to the cable landing there. In a quick search I didn't find datacentres there, which makes me think it would not be too useful. Experts on the local Internet infrastructure would probably be able to answer if it would make sense or not.
This RIPE Labs article has good information on how to avoid effects from unknown attributes showing up at your BGP routers: https://labs.ripe.net/author/berislav_todorovic/bgp-path-attribute-filtering-a-powerful-tool-to-mitigate-alien-attributes/
“Hi Emile, I remember attribute 28 showing up in several previous studies. Interesting to see it causing a problem this time! As bgpdump maintainer, I'd ask you to check out v1.6.2 or higher, since 2020 there is a '-u' flag to output unknown attributes in the short (-m) mode (helpfully submitted by Italo Cunha) - it may make your future parsing life much easier :) Kind regards, Colin”
Thanks Colin, I didn't know, and this would have speeded up my analysis if I had!
Code for looking into AS Adjacency changes is available here: https://github.com/emileaben/as-neighbour-diff
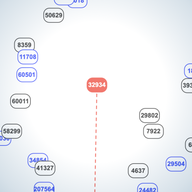
Code on how to create graphs like Figure 1 ( ie. BGP view of how networks in a country interconnect ) is available here: https://github.com/InternetHealthReport/country-as-hegemony-viz
NOG Alliance is helping out network operators in Ukraine: https://nogalliance.org/our-task-forces/keep-ukraine-connected/
An effort related to keeping Urkanian servers/websites online by the Dutch Cloud Community: https://dutchcloudcommunity.nl/community/cloud4ukraine/
We got a request for the HHI scores for other countries. I've put these in a small repo on github together with the code that generated this. repo: https://github.com/emileaben/hhi-eyeballs HHI scores for 2022-03-07 are available here: https://raw.githubusercontent.com/emileaben/hhi-eyeballs/main/eyeball-hhi.2022-03-07.csv
“This is awesome work, thank you! Do you maybe have the script/notebooks/sources to reproduce this? This could be potential used for other countries.”
Hi Jenneth, The observable notebook we used for this is here: https://observablehq.com/@aguformoso/internet-outages-as-seen-by-ripe-atlas . It's a little rough around the edges, so it would be great if you could help improve it!
Thanks for your comment Maxime. I would love to see more analysis too, and the tool allows people to do this. Take for instance this thread on Twitter where Jason Livingood analyses the signals for the US: https://twitter.com/jlivingood/status/1245142990336688130 If others have analysis for specific countries they want to share it would be great to have them collected, for instance as comments to this RIPE Labs post!
Showing 18 comment(s)